Ratio of Square Feet per Office Worker Reflects Demand Reset
Four years since the pandemic disrupted workplaces, office occupiers are still settling on their space requirements and aligning their attendance policies with their occupancy footprints. A look back at the longer-term trend in per-worker occupancy offers insight into the ultimate reset in demand for office space.
The resilience of the labor market has been a major economic story of the past few years. Employment in the major office-using industries is up more than 6% from the end of 2019, a significant figure considering that it fell more than that in a single quarter in early 2020. Meanwhile, the average vacancy rate has continued to increase. There is now 50% more vacant office space in the U.S. than there was entering 2020. The result is the smallest ratio of occupied space per worker ever observed, down 8% in the past four years.
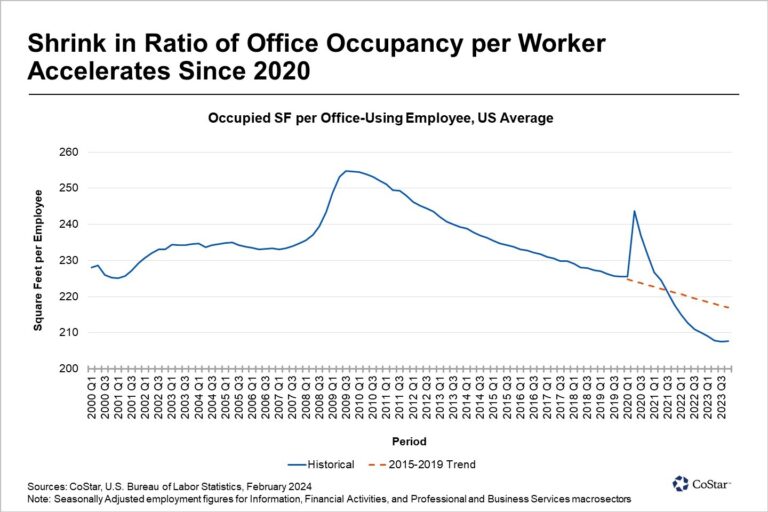
The forces that precipitated rapidly rising vacancy may have been unprecedented, but the trend of shrinking per-worker space requirements is not new. Occupancy per employee had already been falling for a decade as 2020 began, reaching a 20-year low. The pandemic triggered an acceleration that has played out differently across the country.
Nationally, and in most major office markets, per-worker occupancy shrank about twice as fast from 2020 to 2023 as it did from 2016 to 2019. The acceleration has been most pronounced in Dallas, a locus of especially strong job growth; in San Francisco, an area heavily oriented toward the technology sector; and in Austin, Texas, a city that is both.
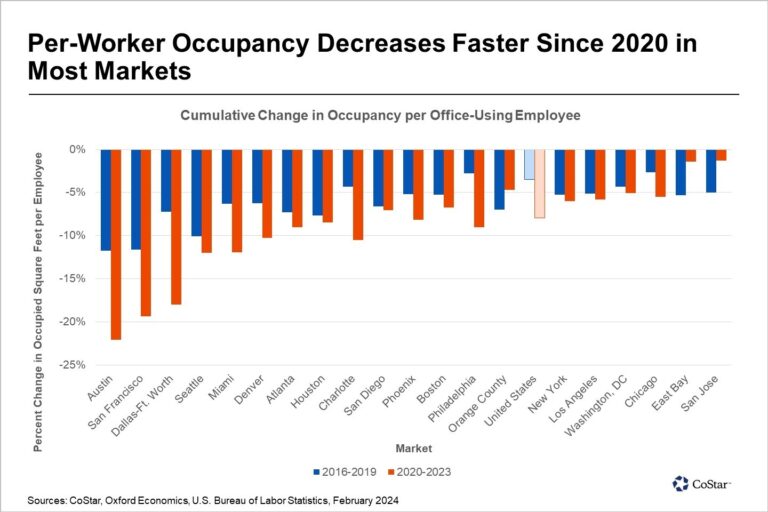
For several office markets with slower job growth, such as New York and Los Angeles, the ratio of square feet per employee has continued to shrink at about the same rate as it had been prior to 2020. In others, such as California’s San Jose and the East Bay, the shrinking has actually slowed. This could be attributed to the outmigration of workers from those markets, a phenomenon that has led to job losses in the East Bay since 2020.
The context of job growth is important in evaluating the trend in occupied space per worker. In times of very strong job growth, it might be expected that occupancy per worker would fall, at least initially. This is because it takes less time to hire than to build, and all those newly hired workers must be supported by existing buildings until additional supply is available. On the other hand, slower job growth could be expected to produce higher occupancy per worker since companies might not be able to adjust their footprints as quickly as their payrolls.
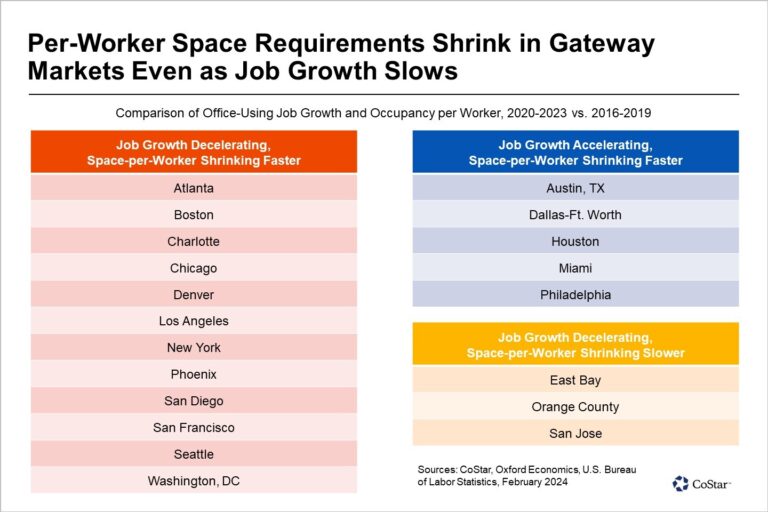
One of these two expected patterns is visible in eight of the top 20 office markets in the United States. Cities with faster job growth in the past four years than in the prior four years include Philadelphia, Miami, Houston, Dallas and Austin, Texas. These markets have also seen faster shrinking of per-worker occupancy.
Another three markets exhibit the same expected relationship, but in the opposite direction. In San Jose, California’s Orange County and the East Bay, easing job growth has been accompanied by a slower shrinking of per-worker space requirements.
In the other 12 largest markets, however, the ratio of occupied space per employee has shrunk faster than prior to 2020, even as employment growth slowed. Significantly, this counterintuitive pattern is on display in seven of the top 10 markets.
One implication is that, for most occupiers, the relationship between employment and office demand is still resetting in response to new ways of leveraging corporate workplaces. Assuming job growth remains relatively stable in the year ahead, the recalibration looks to continue as the second half of pre-pandemic leases begin to roll over.
Article courtesy of CoStar News.