Minority, Women, and Veteran Owned Businesses in the U.S Today
Data from the 2021 Annual Business Survey by the U.S. Census Bureau
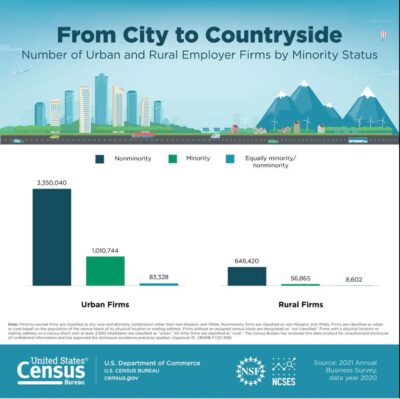
NOV. 10, 2022 — The U.S. Census Bureau today released new estimates on the characteristics of employer businesses. According to the 2021 Annual Business Survey (ABS), which covers reference year 2020, approximately 1.15 million or 19.9% of employer businesses in 2020 were minority-owned; 320,864 (5.6%) were veteran-owned; and around 1.24 million (21.4%) were owned by women. This release also includes demographic data by urban and rural classification, employment size, receipt size, and the years in business of each firm.
Highlights:
- Veteran-owned businesses had an estimated $926.7 billion in receipts, 3.6 million employees, and $176.6 billion in annual payroll.
- Women-owned businesses had an estimated $1.9 trillion in receipts, 10.9 million employees, and $432.1 billion in annual payroll.
- The number of Hispanic-owned businesses grew about 8.2% from 346,836 in 2019 to 375,256 in 2020 and made up about 6.5% of all businesses with an estimated $472.3 billion in annual receipts, 2.9 million employees, and about $105.6 billion in annual payroll.
- There were an estimated 612,194 Asian-owned businesses in the United States in 2020, and an estimated 23.7% or 145,714 of them were in the Accommodation and Food Services sector. Asian-owned businesses had the largest estimated receipts ($841.1 billion) among minority race groups.
- There were an estimated 140,918 Black- or African American-owned businesses with $141.1 billion in annual receipts, 1.3 million employees, and about $42.2 billion in annual payroll. About 27.5% or 38,819 of these businesses were in the Health Care and Social Assistance sector.
- There were an estimated 40,392 American Indian and Alaska Native-owned businesses with $39.7 billion in receipts, 243,523 employees, and about $9.6 billion in annual payroll.
- There were an estimated 8,822 Native Hawaiian and Other Pacific Islander-owned businesses with approximately $8.8 billion in receipts, 60,129 employees, and $2.3 billion in annual payroll.
 The ABS only captures data for employer firms. Data on non-employer firms are available in the Non-Employer Statistics by Demographic (NESD) characteristics tables. The combination of the ABS and NESD provides the only source of detailed and comprehensive statistics on the activities of all U.S. businesses by the demographic characteristics of the business owners.
The 2020 Census revealed that the U.S. population is much more multiracial and more diverse than what the Census Bureau has measured in the past. Nearly all minority race and ethnicity groups saw population gains. Conversely, the White-alone population declined by 8.6% since 2010. These population changes are also captured in the 2021 ABS. The minority race and ethnicity groups saw an increase in business ownership, shown as an increase in the number of non-White and Hispanic-owned firms when comparing to the previous year, while the number of White- and non-Hispanic-owned firms show a decrease when comparing to the 2020 ABS. Like the 2020 Census, the ABS used the improved race and ethnicity question design and coding procedures. These improvements enabled a more accurate depiction of how people self-identify, yielding a more accurate portrait of how people report their Hispanic origin and race within the context of the race and ethnicity questions asked on the survey.
The ABS is sponsored by the National Center for Science and Engineering Statistics (NCSES) within the National Science Foundation and conducted jointly with the Census Bureau. The survey measures research and development for microbusinesses, innovation and technology and provides annual data on select economic and demographic characteristics for businesses and business owners by sex, ethnicity, race and veteran status. NCSES is set to release more data on research and development and innovation in the coming months.
Article and Chart Courtesy of the U.S. Census Bureau