Going With the Flow: State-to-State Migration
________________________________________________________________________________
More people moved across state lines in 2021 than in 2019, many to and from highly populated and neighboring states, according to U.S. Census Bureau estimates released today.
Nearly 7.9 million people in the United States moved between states in 2021, up from almost 7.4 million in 2019.
People moving between states made up 18.8% of all movers in 2021, compared to 16.7% of all movers in 2019.
This increase in state-to-state movers occurred during the COVID-19 pandemic, which had sweeping effects on work and life circumstances such as a shift to remote work, potentially influencing geographic mobility.
Highly populated states, including California, Texas and Florida, experienced some of the largest state-to-state flows. People leaving these states tended to move to other highly populated or neighboring states.
Examining state-to-state migration patterns since the pandemic’s onset is key to understanding demographic, social and economic implications of migration during the pandemic era and beyond.
The Census Bureau regularly publishes data on state-to-state migration flows and just released estimates for 2021 based on 1-year data from the American Community Survey (ACS), which asks respondents if they changed residence in the last year.
By analyzing previous and current places of residence at the state level, we can estimate the number of people moving from origin states to destination states within a given year.
State-to-State Migration
Within the broader context of geographic mobility, the extent of state-to-state migration varied across states. In-movers – or the number of people moving into a state – as a percentage of that state’s total number of movers ranged from 9.9% in California to 43.1% in the District of Columbia (Figure 1).
Most people moving into the District of Columbia came from neighboring states Virginia and Maryland.

Out-movers – or the number of people moving out of a state – as a percentage of that state’s total number of movers ranged from 11.0% in Texas to 46.8% in the District of Columbia (Figure 2). Most people moving out of the District of Columbia moved to Maryland, followed by Virginia.

States where in-movers made up at least 20% of all movers were spread across the country, while states where out-movers made up at least 20% of all movers were concentrated in the West and Northeast.
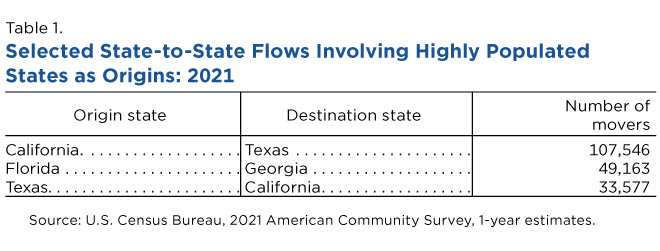
State-to-State Flows and Highly Populated States
Highly populated states, including California, Texas and Florida, experienced some of the largest state-to-state flows.
People leaving these states tended to move to other highly populated or neighboring states (Table 1).
Most people moving from California, for example, relocated to Texas — the largest flow between two states — while most people moving from Florida moved to neighboring Georgia.

People moving to highly populated states tended to come from other states with large populations (Table 2).
For example, most people moving to Florida moved from New York, the fourth largest state in population and a longstanding origin of Florida-bound movers.
State-to-State Flows Between Neighboring States
Moving between neighboring states resulted in sizable state-to-state flows across all regions (Table 3).
In the Northeast, for example, the largest state-to-state flow was from New York to neighboring New Jersey. In the Midwest, it was from Illinois to neighboring Indiana.
Notably, most people moving from a state in the South moved to another state in the same region, with similar flows between Florida and Georgia and vice versa.
