Consumer Price Index, New York-Newark-Jersey City — July 2023
Prices in the New York-Newark-Jersey City area, as measured by the Consumer Price Index for All Urban Consumers (CPI-U), rose 0.4 percent in July, the U.S. Bureau of Labor Statistics reported today. Regional Commissioner William J. Sibley attributed much of the July increase to higher prices for shelter. (Data in this report are not seasonally adjusted. Accordingly, month-to-month changes may reflect seasonal influences.)
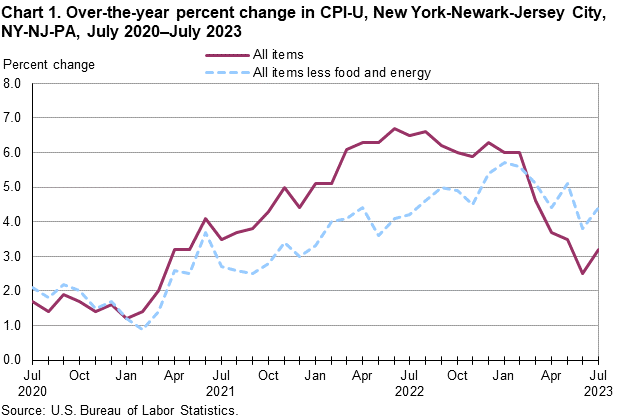
Over the last 12 months, the CPI-U increased 3.2 percent. (See chart 1 and table A.) The index for all items less food and energy rose 4.4 percent over the year. Food prices advanced 3.5 percent. In contrast, energy prices fell 11.5 percent, largely the result of a decrease in the price of gasoline. (See table 1.)
Food
Food prices were unchanged for the month of July, as prices for food at home and for food away from home were flat. Groceries with higher July prices included carbonated drinks, while those with lower prices included soups and other fresh fruits.
For the year ending in July 2023, food prices increased 3.5 percent. Prices for food away from home advanced 6.5 percent, and prices for food at home rose 1.9 percent.
Energy
The energy index advanced 1.1 percent over the month, after increasing 4.1 percent in June. The increase was primarily due to a 1.2-percent rise in household energy prices, which reflected higher prices for electricity (1.8 percent) and for fuel oil. Gasoline prices also rose 0.9 percent in July. In contrast, prices for natural gas ticked down 0.1 percent.
From July 2022 to July 2023, energy prices fell 11.5 percent, fueled by a 21.7-percent drop in gasoline prices. Prices for household energy fell 2.2 percent over the year, with declines in natural gas (-11.1 percent) and fuel oil. These decreases were partially offset by an over-the-year increase in electricity charges (8.1 percent).
All items less food and energy
The index for all items less food and energy increased 0.4 percent in July. A 0.4-percent rise in shelter prices included increases for owners’ equivalent rent (0.7 percent) and residential rent (0.4 percent). Prices for new and used motor vehicles, a category that includes leased and rental vehicles, rose 2.8 percent. On the other hand, apparel prices fell 1.2 percent.
Over the year, the index for all items less food and energy advanced 4.4 percent. Shelter prices, up 5.8 percent, included a 5.9-percent increase for owners’ equivalent rent and a 5.8-percent rise for residential rent. Other categories with increases included new and used motor vehicles (4.7 percent), recreation (4.0 percent), and education and communication (2.5 percent). A 1.4-percent decline in medical care prices partly offset the increases.