Celebrating National Nonprofit Day with BLS Data
To observe National Nonprofit Day this week, we’re highlighting some statistics about nonprofit organizations and the people who work for them. Employment in nonprofits numbered 12.5 million in 2017 (the most recent year for which we have data). That was 10.2 percent of all private sector employment.
To obtain these statistics, we matched our Quarterly Census of Employment and Wages data to a publicly available Internal Revenue Service list of tax-exempt organizations to produce estimates of nonprofit employment, wages, and establishment size.
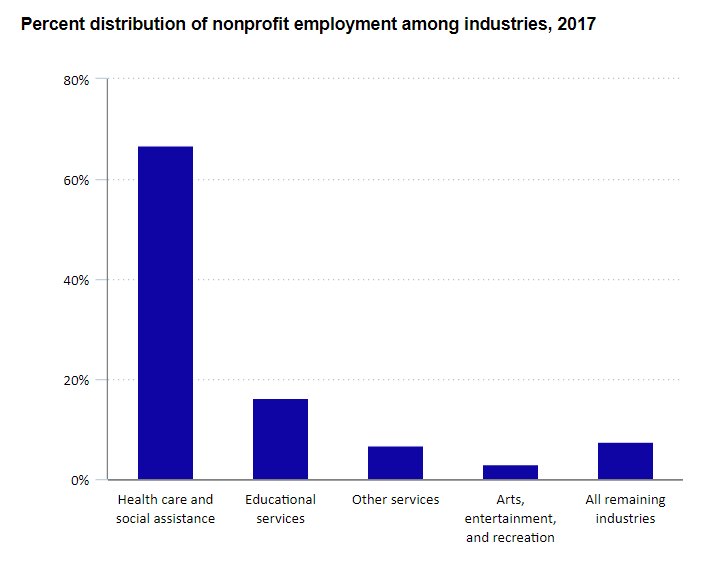
Most nonprofit employment is in just four industries. Two-thirds of nonprofit jobs in 2017 were in health care and social assistance, with about half of those jobs in hospitals. Another 16 percent of nonprofit employment was in educational services, which includes private K-12 schools and colleges. The other services sector accounted for 7 percent, with the bulk concentrated in religious, civic, professional, and similar organizations. Three percent was in the arts, entertainment, and recreation, which includes museums, historical sites, and similar institutions.
Although health care and social assistance accounted for the greatest number of nonprofit jobs, educational services was the industry with the highest share of nonprofit jobs. Seventy-one percent of educational services jobs were in nonprofits. Within educational services, 9 of 10 jobs in private colleges and universities were in nonprofits, as were 8 of 10 jobs in private elementary and secondary schools. In contrast, nonprofits accounted for fewer than half of jobs in educational support services and in private technical and trade schools. High shares also occurred in health care and social assistance (43 percent); other services (19 percent); and arts, entertainment, and recreation (16 percent).

Nonprofits are located throughout the United States. The District of Columbia had the highest share of nonprofit employment, 25.6 percent. Vermont, Maine, Massachusetts, New York, and Rhode Island also had high shares of nonprofit employment. Of the 1,685 counties for which BLS published data, 752 counties had higher shares of nonprofit employment than the national average of 10.2 percent in 2017. Most of these counties were in either the Northeast or the Midwest. The county with the highest share of nonprofit employment was Montour County, Pennsylvania, where 64.1 percent of private sector jobs were in nonprofits.
In addition to our data about nonprofit businesses, we have data about people who work in these organizations from our monthly Current Population Survey. The data presented here are annual averages for 2022. Among those working for nonprofit organizations in 2022, women outnumbered men, accounting for two-thirds of nonprofit workers. Nonprofit workers are part of the private sector. In the private sector overall, just under half of workers were women. Hispanics or Latinos accounted for 10.4 percent of nonprofit workers, lower than the 19.6 percent for all private sector workers. (People of Hispanic or Latino ethnicity may be of any race.) Nonprofit workers were also less likely to be foreign born (11.9 percent) than were private sector workers overall (19.0 percent).

Among workers age 25 and older, those in nonprofit organizations tend to have higher educational attainment than private sector workers overall. In 2022, almost two-thirds of nonprofit workers were college graduates; 32.7 percent had an advanced degree, which includes master’s, professional and doctoral degrees, and 31.9 percent had a bachelor’s degree only. Among private sector workers overall, 14.6 percent had an advanced degree, and 26.8 percent had a bachelor’s degree only. Just 1.7 percent of nonprofit workers had less than a high school diploma, compared with 6.8 percent of workers in the private sector.
Full-time wage and salary workers at nonprofit organizations generally had higher median usual weekly earnings in 2022 than workers overall. Median usual weekly earnings for nonprofit workers were $1,163, compared with $1,026 for all private sector workers. Women working for nonprofit organizations earned $1,101 per week, compared with $920 for all women in the private sector. The story was similar for Hispanics or Latinos, with nonprofit earnings of $1,006 and private sector earnings of $802. Workers with more education tend to have higher earnings, so these differences partially reflect nonprofit workers’ higher educational attainment. These earnings comparisons do not control for other factors, such as age, occupation, industry, and geographic region.

Article courtesy of the US Bureau of Labor Statistics.