Remote Work During the Pandemic Shifted Daytime Population of Cities
The daytime population of traditional U.S. job centers plummeted in 2020 after the COVID-19 pandemic hit and lockdowns and social distancing pushed more people to work from home.
This shift to remote work in large segments of the workforce significantly impacted commuting and consumer spending at restaurants, retail outlets and the demand for commercial real estate, according to research presented during a recent webinar hosted by the U.S. Census Bureau’s Local Employment Dynamics (LED).
The research used the Census Bureau’s Longitudinal Employer-Household Dynamics (LEHD) Origin-Destination Employment Statistics (LODES) commuting data, coupled with statistics from other federal government agencies and outside organizations.
During the session that explored the impact of remote work on daytime populations in job centers, Chris Worley, a consultant with Fourth Economy Consulting, presented research showing some of these population shifts may be here to stay.
Why Spatial Shift Happens
He cited the uptick in remote work as the key reason for the shift in daytime population.
Research on paid job postings from LinkedIn revealed remote work shot up 457% from 2020 to 2021. Information and professional, scientific and technical services were among the industries most affected by the switch while retail trade, manufacturing, and accommodations and food services were least eligible for remote work.
The traditional 9-to-5 workday may have become a thing of the past. Surveys show workers expect workplace adaptations to stick, because flexible schedules and reduced commute times outweigh challenges of isolation and longer hours. According to research, employees value flexibility and believe a hybrid model is ideal.
Commuting shifts also affected where people spent their money. Fewer workers meant fewer shoppers and diners for small businesses in job hubs.
For example, workers were no longer stopping at local coffee shops for their daily lattes, dropping off their dry cleaning or gathering at their favorite lunch spots. Places with many daytime jobs but fewer residents were the most impacted by the move to remote work.
Even sales of work apparel, no longer needed when working from home, dropped.
“The sales of dress shoes in 2020 were down from the 2019 levels,” Worley said. “You don’t really wear them around the house. They’re meant to be seen by other people.”
This was also reflected in a drop in sales, value of shipments or revenue of footwear manufacturing, according to the Annual Survey of Manufactures: from $1.8 billion in 2019 to $1.5 billion in 2020, the first year of the pandemic. The numbers bounced back in 2021 but not up to pre-pandemic level.
The shift to remote work also pushed down demand for office space. On the upside: fewer commuters on the road reduced carbon emission and resulted in some of the cleanest air cities had seen in years, according to research.
Pairing Data Sources for Answers
By pairing Bureau of Labor Statistics survey on the ability to work remotely by industry and Longitudinal Employer-Household Dynamics (LEHD) Origin-Destination Employment Statistics (LODES) commuting data, Worley’s research revealed a shift in daytime population from traditional urban job centers to suburban and rural areas.
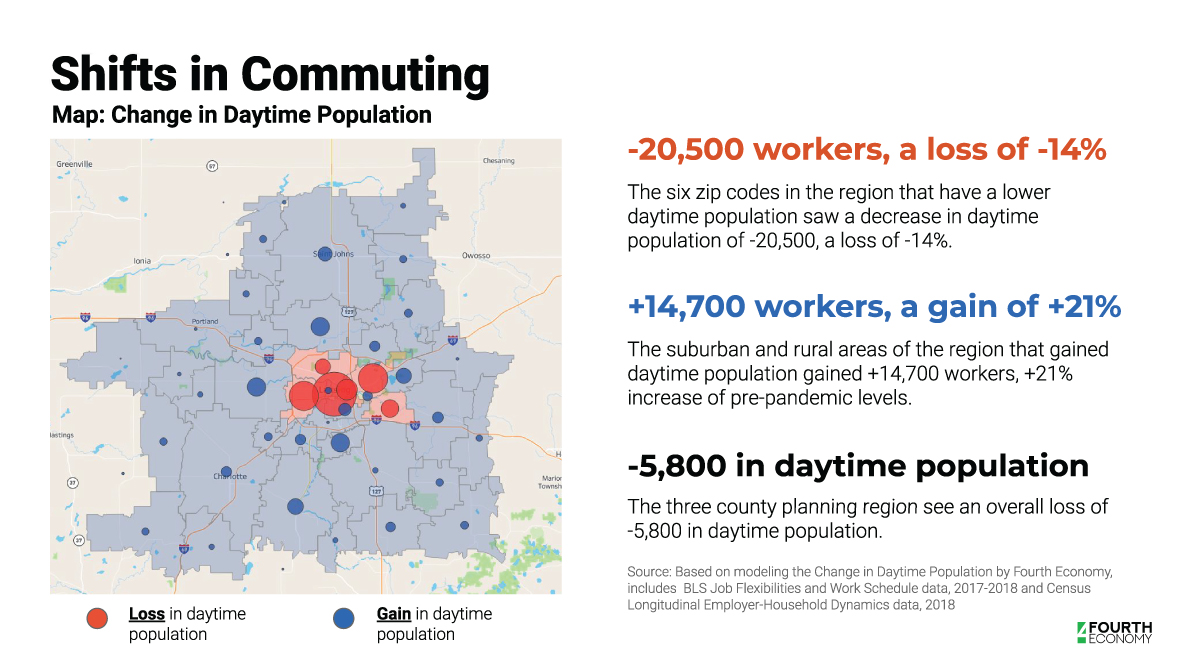
He noted, for example, that remote work in the Lansing, Michigan, region clearly drove a shift from the urban core to suburban and rural areas.
This region’s economy is based primarily on education, health, manufacturing, and emerging finance and tech sectors. Major employers in the Michigan’s capital include Michigan State University (East Lansing), state government and a regional health system.
The map pictured here shows change in daytime populations before and after the pandemic. Areas in blue gained daytime population and those in red lost daytime population.
Worley’s research used pre-pandemic data for home and work locations of workers to estimate the change in daytime population based on remote work information by industry. It is most reflective of conditions associated with the first two years of the pandemic.
The three-county region’s daytime population fell by 5,800 because of fewer inbound commuters.
Free tools used for Worley’s analysis include the Census Bureau’s OnTheMap and other free software, including Tableau Public for mapping. The primary data come from OnTheMap’s Home and Work Area Profiles.
OnTheMap is a web-based mapping and reporting application that shows where workers live and work. The Inflow/Outflow analysis generates results showing the count and characteristics of worker flows to, from and within the selection area.
Is Remote Work Here to Stay?
Industries are segueing into new business models, such as virtual workspaces, to remain relevant. The shift to the new normal of remote work has far-reaching implications across a variety of areas.
For example, recent results from the American Community Survey (ACS) show that public transportation’s share of total commuting fell from 5% in 2019 to 2.5% in 2021 — the lowest percentage of workers commuting by public transportation that has ever been recorded by the ACS.
Surveys have also shown that more Americans are considering relocating to more affordable or convenient U.S. cities or regions amid growing acceptance of remote work.
Article Courtesy of the U.S. Census Bureau.
