GDP By Industry and Corporate Profits in 2023
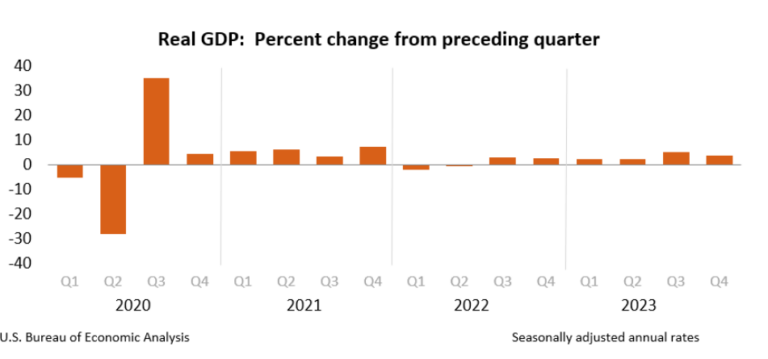
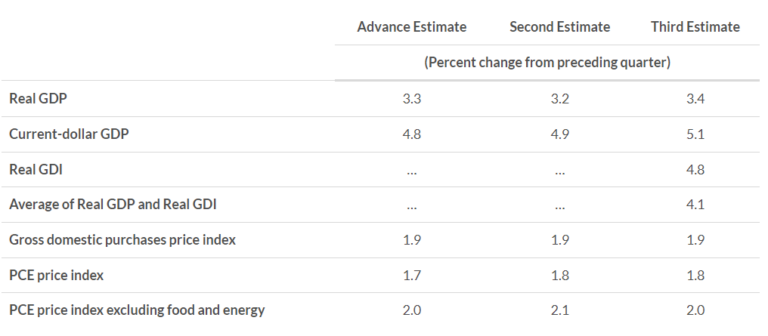
Real gross domestic product (GDP) increased at an annual rate of 3.4 percent in the fourth quarter of 2023 (table 1), according to the “third” estimate released by the Bureau of Economic Analysis. In the third quarter, real GDP increased 4.9 percent.
The GDP estimate released today is based on more complete source data than were available for the “second” estimate issued last month. In the second estimate, the increase in real GDP was 3.2 percent. The update primarily reflected upward revisions to consumer spending and nonresidential fixed investment that were partly offset by a downward revision to private inventory investment (refer to “Updates to GDP”).
The increase in real GDP primarily reflected increases in consumer spending, state and local government spending, exports, nonresidential fixed investment, federal government spending, and residential fixed investment that were partly offset by a decrease in private inventory investment. Imports, which are a subtraction in the calculation of GDP, increased (table 2).
Compared to the third quarter of 2023, the deceleration in real GDP in the fourth quarter primarily reflected a downturn in private inventory investment and slowdowns in federal government spending and residential fixed investment. Imports decelerated.
Current‑dollar GDP increased 5.1 percent at an annual rate, or $346.9 billion, in the fourth quarter to a level of $27.96 trillion, an upward revision of $12.4 billion from the previous estimate (tables 1 and 3). More information on the source data that underlie the estimates is available in the “Key Source Data and Assumptions” file on BEA’s website.
The price index for gross domestic purchases increased 1.9 percent in the fourth quarter, the same as in the previous estimate (table 4). The personal consumption expenditures (PCE) price index increased 1.8 percent, the same as the previous estimate, and the PCE index excluding food and energy prices increased 2.0 percent, a downward revision of 0.1 percentage point.
Personal Income
Current-dollar personal income increased $230.2 billion in the fourth quarter, an upward revision of $10.7 billion from the previous estimate. The increase primarily reflected increases in compensation, personal income receipts on assets, and proprietors’ income (table 8).
Disposable personal income increased $190.4 billion, or 3.8 percent, in the fourth quarter, a downward revision of $12.1 billion from the previous estimate. Real disposable personal income increased 2.0 percent, a downward revision of 0.2 percentage point.
Personal saving was $815.5 billion in the fourth quarter, an upward revision of $6.3 billion from the previous estimate. The personal saving rate—personal saving as a percentage of disposable personal income—was 4.0 percent in the fourth quarter, an upward revision of 0.1 percentage point.
Gross Domestic Income and Corporate Profits
Real gross domestic income (GDI) increased 4.8 percent in the fourth quarter, compared with an increase of 1.9 percent in the third quarter. The average of real GDP and real GDI, a supplemental measure of U.S. economic activity that equally weights GDP and GDI, increased 4.1 percent in the fourth quarter, compared with an increase of 3.4 percent (table 1).
Profits from current production (corporate profits with inventory valuation and capital consumption adjustments) increased $133.5 billion in the fourth quarter, compared with an increase of $108.7 billion in the third quarter (table 10).
Profits of domestic financial corporations increased $5.9 billion in the fourth quarter, compared with an increase of $9.0 billion in the third quarter. Profits of domestic nonfinancial corporations increased $136.5 billion, compared with an increase of $90.8 billion. Rest-of-the-world profits decreased $8.9 billion, in contrast to an increase of $8.8 billion. In the fourth quarter, receipts decreased $20.1 billion, and payments decreased $11.2 billion.
Updates to GDP
With the third estimate, upward revisions to consumer spending, nonresidential fixed investment, and state and local government spending were partly offset by downward revisions to private inventory investment and exports. Imports were revised down. For more information, refer to the Technical Note. For information on updates to GDP, refer to the “Additional Information” section that follows.
Real GDP by Industry
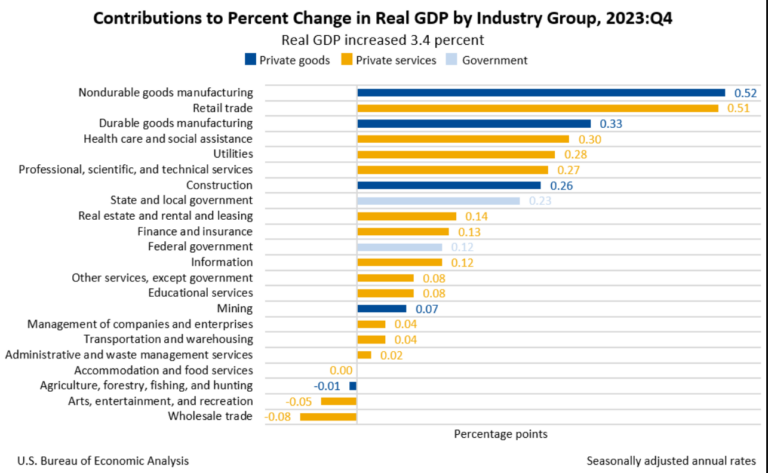
Today’s release includes estimates of GDP by industry, or value added—a measure of an industry’s contribution to GDP. Private goods-producing industries increased 7.0 percent, private services-producing industries increased 2.6 percent, and government increased 3.1 percent (table 12). Overall, 18 of 22 industry groups contributed to the fourth-quarter increase in real GDP.
- Within private goods-producing industries, the leading contributors to the increase were nondurable goods manufacturing (led by petroleum and coal products and chemical products), durable goods manufacturing (led by machinery), and construction (table 13).
- Within private services-producing industries, the leading contributors to the increase were retail trade (led by motor vehicle and parts dealers), health care and social assistance (led by ambulatory health care services), utilities, and professional, scientific, and technical services (led by computer systems design and related services).
- The increase in government reflected increases in state and local government as well as federal government.
Gross Output by Industry
Real gross output—principally a measure of an industry’s sales or receipts, which includes sales to final users in the economy (GDP) and sales to other industries (intermediate inputs)—increased 2.4 percent in the fourth quarter. This reflected an increase of 3.7 percent for private goods-producing industries, an increase of 2.0 percent for private services-producing industries, and an increase of 1.8 percent for government (table 16). Overall, 13 of 22 industry groups contributed to the increase in real gross output.
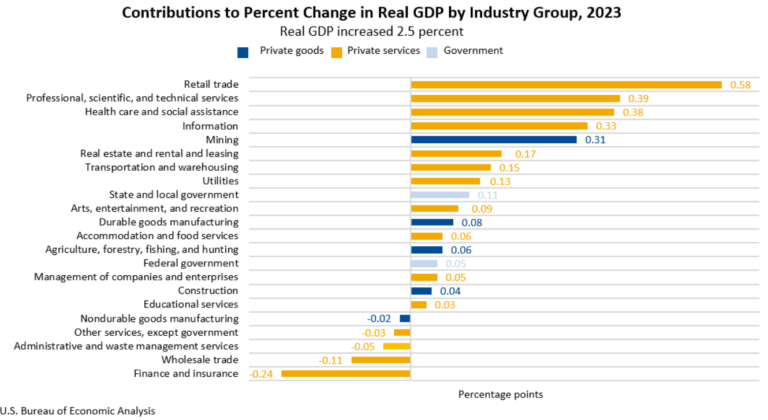
GDP for 2023
Real GDP increased 2.5 percent in 2023 (from the 2022 annual level to the 2023 annual level), compared with an increase of 1.9 percent in 2022 (table 1). The increase in real GDP in 2023 primarily reflected increases in consumer spending, nonresidential fixed investment, state and local government spending, exports, and federal government spending that were partly offset by decreases in residential fixed investment and private inventory investment. Imports decreased (table 2).
Gross Domestic Income and Corporate Profits for 2023
Real GDI increased 0.5 percent in 2023, compared with an increase of 2.1 percent in 2022 (table 1). The average of real GDP and real GDI increased 1.5 percent in 2023, compared with an increase of 2.0 percent in 2022.
In 2023, profits from current production (corporate profits with inventory valuation and capital consumption adjustments) increased $49.3 billion, compared with an increase of $285.9 billion in 2022 (table 10). Profits of domestic financial corporations decreased $55.2 billion, compared with a decrease of $0.9 billion in 2022. Profits of domestic nonfinancial corporations increased $66.6 billion, compared with an increase of $247.6 billion. Rest-of-the-world profits increased $37.9 billion, compared with an increase of $39.2 billion.