Fewer People Reported Moving in Previous Year in 2021 Than in 2019
Many believed the spike in home-based work associated with the COVID-19 pandemic would lead to greater geographic mobility. Instead, the number of domestic movers in the United States declined from 2019 to 2021.
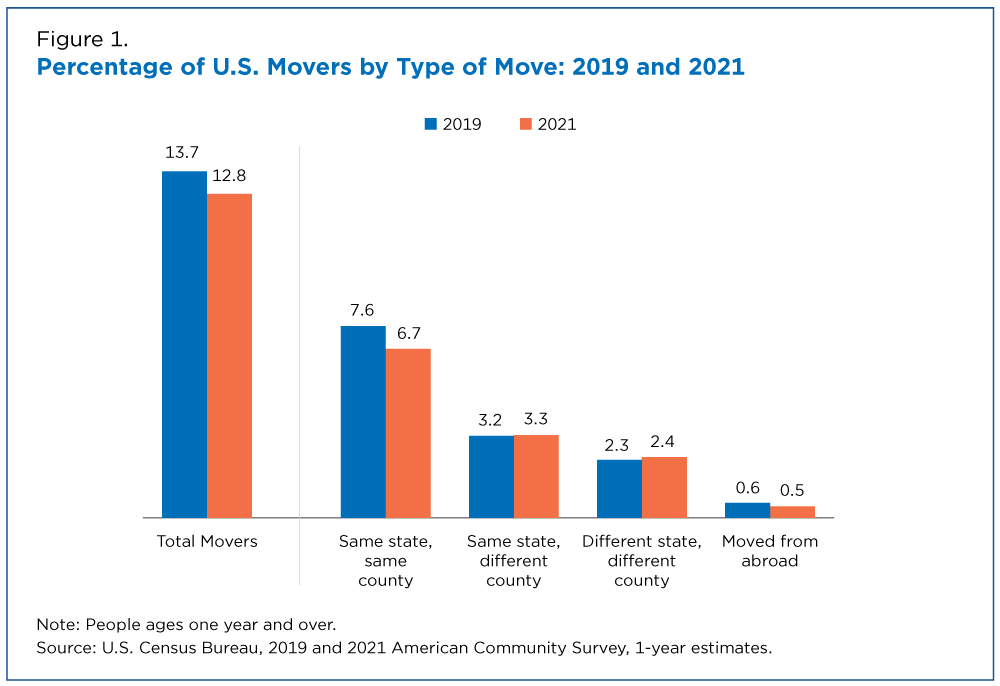
The percentage of people in the United States who moved in the previous year declined from about 14% to roughly 13%, according to the 2019 and 2021 American Community Survey (ACS) 1-year estimates.
These data reference where people lived one year prior to 2019 and 2021. Because the 2021 period includes moves that may have occurred prior to the start of the pandemic in March 2020, comparisons between 2019 and 2021 may not reflect the full impact of the pandemic on mover rates.
While these findings do not align exactly with the popular narrative that the ability to work remotely would increase mobility, they do not outright discount it. At the national scale, moves to some states did increase between 2019 and 2021, suggesting a more nuanced and less sweeping narrative.
Types of Moves
The ACS 1-year data provide information on the types of moves happening in the United States and at what geographic level they occur providing insight into changes in national migration patterns.
Moves are classified by the type of geography which people move to and from:
- In 2019, 7.6% of the U.S. population ages one year or older moved to a new residence in the same county; by 2021, that percentage had declined to 6.7% (Figure 1).
- The percentage of those who reported that they had moved the previous year to a new residence in a different county within the same state increased from 3.2% to 3.3%. between 2019 and 2021.
- Movers to a new residence in a different state increased from 2.3% to 2.4% in the same period.
- The percentage of movers from abroad ages one year or older declined slightly from 0.6% to 0.5% during this period.
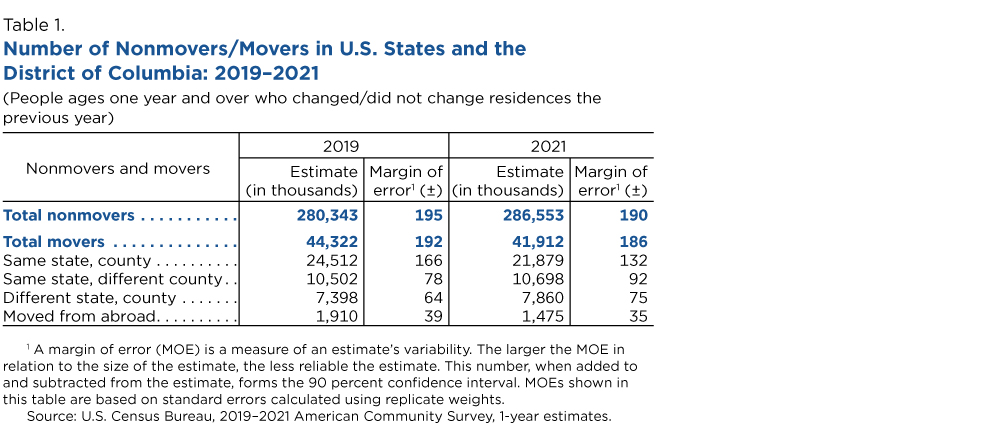
Declines in the total mover rate appear to be tied to a drop in the number of people making same-county moves, the largest category (roughly 25 million in 2019 and about 22 million in 2021 — Table 1).
Moves Across Areas
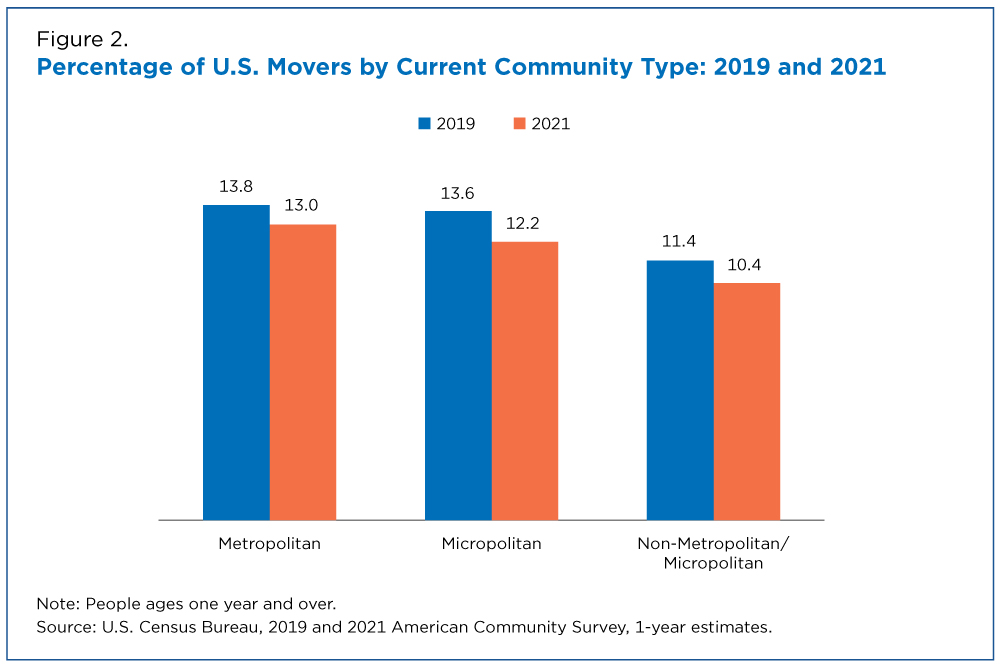
Mover rates across different types of communities also varied, including metropolitan areas (metro), micropolitan areas (micro), and nonmetropolitan/micropolitan (non-metro/micro).
The 2019 and 2021 data show declines in mover rates in different communities:
- The share of movers living in metro areas in 2019 declined from 13.8% to 13.0% in 2021 (Figure 2).
- There was a higher rate of decline in micro (than metro) areas, where the mover rate declined from 13.6% to 12.2%.
- Nonmetro/micro areas saw mover rates decline from 11.4% to 10.4%.
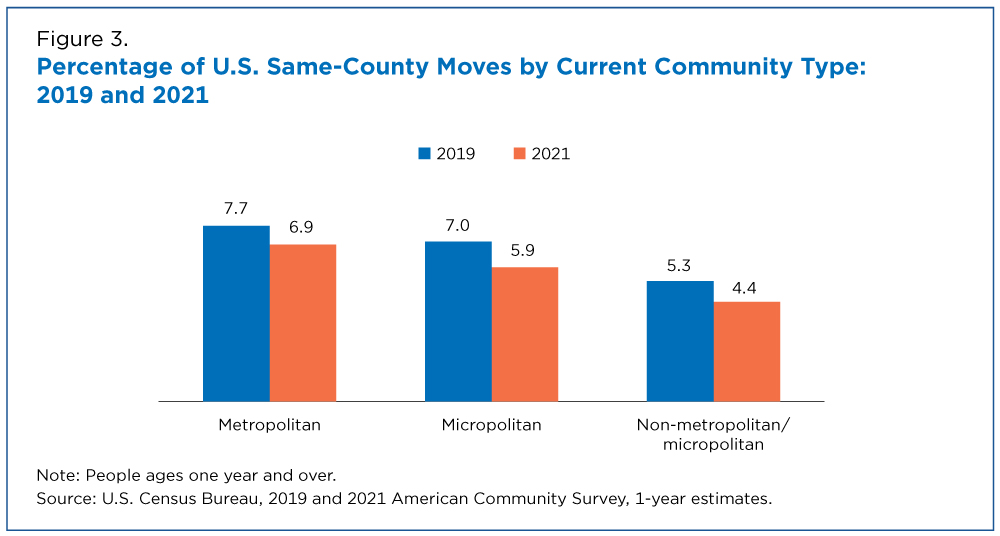
Much like the national pattern, these changes appear to be linked to declines in same-county mover rates. Among mover types, same-county movers accounted for the greatest percentage decline in metro, micro and nonmetro/micro areas (Figure 3). In micropolitan areas, the percentage of same-county movers dropped from 7.0% to 5.9%.
Regional Moves
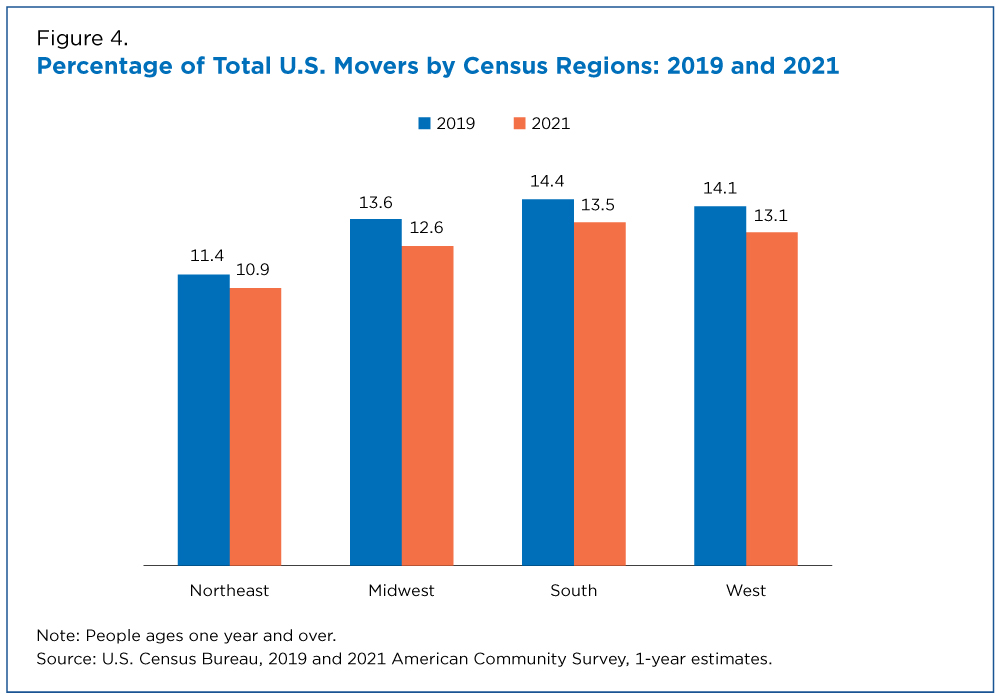
There are four U.S. Census Bureau regions: Northeast, Midwest, South and West. In line with national trends, all four regions experienced declines in the total percentage of movers between the 2019 and 2021 data.
The Northeast saw the smallest decline in mover rates, from 11.4% to 11.0%. The Midwest, South and West each experienced declines around 1 percentage point between during that period. In all four instances, the percentage of same-county movers declined notably.
