August 2025 Consumer Price Index
The Consumer Price Index for All Urban Consumers (CPI-U) increased 0.4 percent on a seasonally adjusted basis in August, after rising 0.2 percent in July, the U.S. Bureau of Labor Statistics reported today. Over the last 12 months, the all items index increased 2.9 percent before seasonal adjustment. The index for shelter rose 0.4 percent in August and was the largest factor in the all items monthly increase. The food index increased 0.5 percent over the month as the food at home index rose 0.6 percent and the food away from home index increased 0.3 percent. The index for energy rose 0.7 percent in August as the index for gasoline increased 1.9 percent over the month. The index for all items less food and energy rose 0.3 percent in August, as it did in July. Indexes that increased over the month include airline fares, used cars and trucks, apparel, and new vehicles.
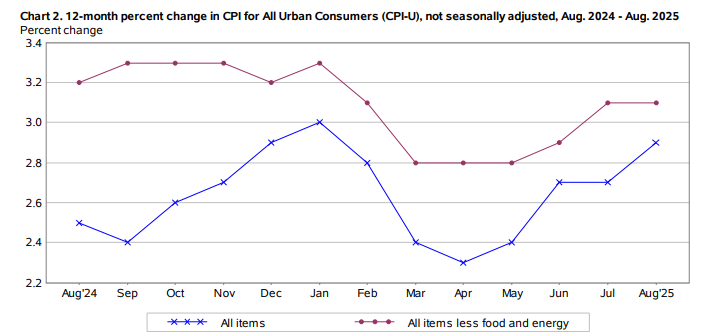
The indexes for medical care, recreation, and communication were among the few major indexes that decreased in August. The all items index rose 2.9 percent for the 12 months ending August, after rising 2.7 percent over the 12 months ending July. The all items less food and energy index rose 3.1 percent over the last 12 months. The energy index increased 0.2 percent for the 12 months ending August. The food index increased 3.2 percent over the last year.
Food
The index for food rose 0.5 percent in August, after being unchanged in July. The food at home index increased 0.6 percent over the month. All six major grocery store food group indexes increased in August. The index for fruits and vegetables rose 1.6 percent over the month as the index for tomatoes increased 4.5 percent and the index for apples rose 3.5 percent.
The meats, poultry, fish and eggs index increased 1.0 percent in August with the beef index rising 2.7 percent. The index for nonalcoholic
beverages increased 0.6 percent and the index for other food at home increased 0.1 percent. Both the dairy and related products index and the cereals and bakery products index also rose 0.1 percent in August.
The food away from home index rose 0.3 percent in August. The index for full service meals rose 0.4 percent over the month and the index for limited service meals increased 0.1 percent. The index for food at home rose 2.7 percent over the 12 months ending in August. The meats, poultry, fish, and eggs index rose 5.6 percent over the last 12 months. The index for nonalcoholic beverages increased 4.6 percent over the same period and the index for other food at home rose 1.5 percent. The
fruits and vegetables index increased 1.9 percent over the 12 months ending in August. The index for cereals and bakery products rose 1.1 percent and the index for dairy and related products increased 1.3
percent over the same period.
The food away from home index rose 3.9 percent over the last year. The index for full service meals rose 4.6 percent and the index for limited service meals rose 3.2 percent over the same period.
Energy
The index for energy increased 0.7 percent in August, after falling 1.1 percent in July. The gasoline index increased 1.9 percent over the month. (Before seasonal adjustment, gasoline prices increased 0.3
percent in August.) The index for electricity increased 0.2 percent over the month while the index for natural gas decreased 1.6 percent over the same period.
The index for energy increased 0.2 percent over the past 12 months. The gasoline index fell 6.6 percent over this 12-month span and the fuel oil index fell 0.5 percent over the same period. In contrast, the
index for electricity increased 6.2 percent over the last 12 months and the index for natural gas rose 13.8 percent.
Read more at the US Bureau of Labor Statistics.