April 2023 Labor Statistics and Unemployment Updates Released
_______________________________________________________________________________________________
Total nonfarm payroll employment rose by 253,000 in April, and the unemployment rate changed little at 3.4 percent, the U.S. Bureau of Labor Statistics reported today. Employment continued to trend up in professional and business services, health care, leisure and hospitality, and social assistance.
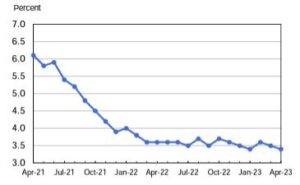
This news release presents statistics from two monthly surveys. The household survey measures labor force status, including unemployment, by demographic characteristics. The establishment survey measures nonfarm employment, hours, and earnings by industry. For more information about the concepts and statistical methodology used in these two surveys, see the Technical Note. Household Survey Data Both the unemployment rate, at 3.4 percent, and the number of unemployed persons, at 5.7 million, changed little in April. The unemployment rate has ranged from 3.4 percent to 3.7 percent since March 2022. (See table A-1.)
Among the major worker groups, the unemployment rates for adult men (3.3 percent), adult women (3.1 percent), teenagers (9.2 percent), Whites (3.1 percent), Blacks (4.7 percent), Asians (2.8 percent), and Hispanics (4.4 percent) showed little or no change in April. (See tables A-1, A-2, and A-3.)
The number of job losers and persons who completed temporary jobs decreased by 307,000 in April to 2.6 million. (See table A-11.) The number of persons jobless less than 5 weeks decreased by 406,000 to 1.9 million in April. The number of long-term unemployed (those jobless for 27 weeks or more) changed little over the month at 1.2 million and accounted for 20.6 percent of the total unemployed. (See table A-12.)
Both the labor force participation rate, at 62.6 percent, and the employment-population ratio, at 60.4 percent, were unchanged in April. These measures remain below their pre-pandemic February 2020 levels (63.3 percent and 61.1 percent, respectively). (See table A-1.) The number of persons employed part time for economic reasons, at 3.9 million, was little changed in April. These individuals, who would have preferred full-time employment, were working part time because their hours had been reduced or they were unable to find full-time jobs. (See table A-8.)
The number of persons not in the labor force who currently want a job increased by 346,000 over the month to 5.3 million. These individuals were not counted as unemployed because they were not actively looking for work during the 4 weeks preceding the survey or were unavailable to take a job. (See table A-1.) Among those not in the labor force who wanted a job, the number of persons marginally attached to the labor force increased by 191,000 to 1.5 million in April. These individuals wanted and were available for work and had looked for a job sometime in the prior 12 months but had not looked for work in the 4 weeks preceding the survey.
The number of discouraged workers, a subset of the marginally attached who believed that no jobs were available for them, was little changed over the month at 364,000. (See Summary table A.) Establishment Survey Data Total nonfarm payroll employment increased by 253,000 in April, compared with the average monthly gain of 290,000 over the prior 6 months.
In April, employment continued to trend up in professional and business services, health care, leisure and hospitality, and social assistance. (See table B-1.) In April, employment continued to trend up in professional and business services (+43,000). Over the prior 6 months, the average monthly gain in the industry was 25,000. In April, professional, scientific, and technical services added 45,000 jobs. Employment in temporary help services continued to trend down over the month (-23,000) and is down by 174,000 since its peak in March 2022.
Employment in health care increased by 40,000 in April, compared with the average monthly gain of 47,000 over the prior 6 months. Over the month, employment continued to trend up in ambulatory health care services (+24,000), nursing and residential care facilities (+9,000), and hospitals (+7,000). Employment in leisure and hospitality continued to trend up in April (+31,000), largely in food services and drinking places (+25,000). Leisure and hospitality had added an average of 73,000 jobs per -3- month over the prior 6 months. Employment in this industry remains below its pre-pandemic February 2020 level by 402,000, or 2.4 percent.
In April, social assistance added 25,000 jobs, in line with the average monthly gain of 21,000 over the prior 6 months. Individual and family services added 21,000 jobs over the month. Employment in financial activities increased by 23,000 in April, with gains in insurance carriers and related activities (+15,000) and in real estate (+9,000). Employment in financial activities changed little in the first 3 months of this year. Government employment continued its upward trend in April (+23,000). Government had added an average of 52,000 jobs per month over the prior 6 months.
Overall, employment in government is below its February 2020 level by 301,000, or 1.3 percent. Employment in mining, quarrying, and oil and gas extraction rose by 6,000 in April and has risen by 102,000 since a recent low in February 2021. Nearly all of the April job gain occurred in support activities for mining. Employment was little changed over the month in other major industries, including construction, manufacturing, wholesale trade, retail trade, transportation and warehousing, information, and other services.
In April, average hourly earnings for all employees on private nonfarm payrolls rose by 16 cents, or 0.5 percent, to $33.36. Over the past 12 months, average hourly earnings have increased by 4.4 percent. In April, average hourly earnings of private-sector production and nonsupervisory employees rose by 11 cents, or 0.4 percent, to $28.62. (See tables B-3 and B-8.) The average workweek for all employees on private nonfarm payrolls was unchanged at 34.4 hours in April.
In manufacturing, the average workweek was little changed at 40.2 hours, and overtime remained at 2.9 hours. The average workweek for production and nonsupervisory employees on private nonfarm payrolls edged down by 0.1 hour to 33.8 hours. (See tables B-2 and B-7.) The change in total nonfarm payroll employment for February was revised down by 78,000, from +326,000 to +248,000, and the change for March was revised down by 71,000, from +236,000 to +165,000. With these revisions, employment in February and March combined is 149,000 lower than previously reported. (Monthly revisions result from additional reports received from businesses and government agencies since the last published estimates and from the recalculation of seasonal factors.)
Click Here For Survey Data Tables A & B Courtesy of the U.S. Bureau of Labor Statistics.